Content Analysis of Jesus Texts
The following table
shows the number of content elements that are found in both texts of the
indicated pair. This is obtained by simply counting the number of Xs from
the first table that appear in the same row for two given texts. (The table
is of course symmetric about the diagonal.)
|
|
|
|
|
|
|
|
|
|
|
|
|
|
| Co |
|
|
|
|
|
|
|
|
|
|
|
|
| M |
|
|
|
|
|
|
|
|
|
|
|
|
| Acts2 |
|
|
|
|
|
|
|
|
|
|
|
|
| Acts3 |
|
|
|
|
|
|
|
|
|
|
|
|
| Acts5 |
|
|
|
|
|
|
|
|
|
|
|
|
| Acts10 |
|
|
|
|
|
|
|
|
|
|
|
|
| Acts13 |
|
|
|
|
|
|
|
|
|
|
|
|
| L |
|
|
|
|
|
|
|
|
|
|
|
|
| TF |
|
|
|
|
|
|
|
|
|
|
|
|
| Ig |
|
|
|
|
|
|
|
|
|
|
|
|
| Jus |
|
|
|
|
|
|
|
|
|
|
|
|
| ORC |
|
|
|
|
|
|
|
|
|
|
|
|
| Average |
|
|
|
5.6 |
|
|
|
7.4 |
|
|
|
|
| St. dev. | 1.7 |
|
|
|
|
|
|
|
|
|
|
|
| Maximum | 7 | 6 | 11 | 13 | 4 | 11 | 13 | 16 | 16 | 5 |
|
|
This table provides food for thought. Again, the Luke (Emmaus) -Testimonium relationship is the highest of any pair of texts. This table also demonstrates the similarity of the speeches of Acts to each other and to Luke's Emmaus passage. Such a similarity is of course expected: the speeches are all by the same author, all giving his version of the gospel, the "Lukan kerygma." This table indicates that the Testimonium Flavianum belongs in this same family of kerygma, with an especially close relationship to what is plausibly the earliest form (as it appears earliest in Luke-Acts), that found in the Emmaus narrative.
There are 66 pairs in this sample. Their distribution forms a bell-shaped curve with mean of 5.2 and standard deviation of 3.2. The L-TF pair, at 16, is an extreme outlier on the right tail of this curve, falling more than 3.3 standard deviations away. This is significant at the 99% confidence level.
There
are many other ways to look at the data. For example, consider the maximum
number of positive correspondences found for each text (shown in the bottom
row). The average of the maxima is 9.5 and the standard deviation 4.4 (8.9
and 4.0 if we exclude the maxima of the maxima). Using small-sample t-statistics
this is significant at better than the 90% level.
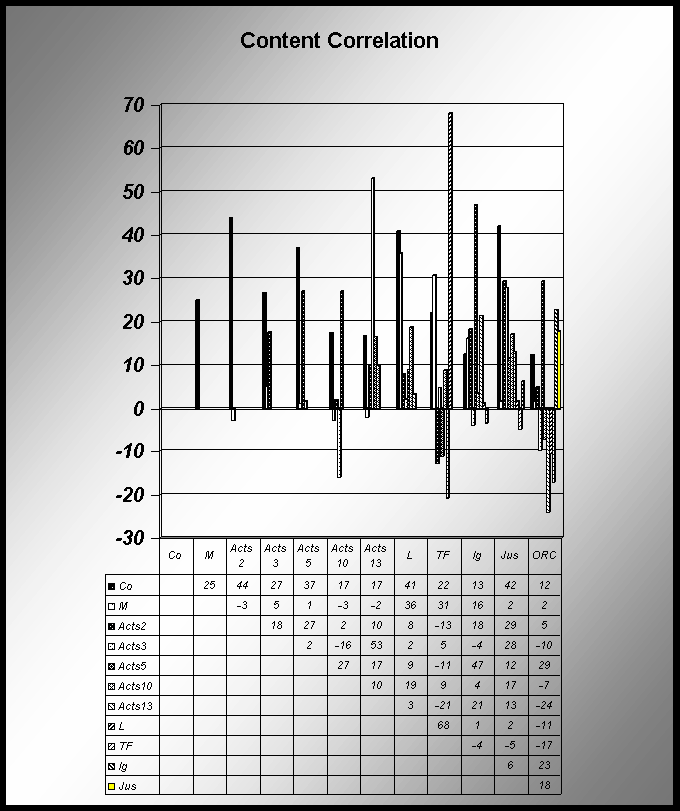
The correlation analysis done previously just for TF pairs can now be done on all pairs. This will take into account both the positive and negative correspondences. The results are shown in the following table and graph. (Correlation coefficients are shown in hundredths.)
Many interesting things can be learned from examing this table. For example, the selection from Acts 2 is very similar to that of Acts 3, and 1 Co has relatively good correlation with Acts 2, Justin, and Luke (but not with the TF). Recall this means that some content is shared while also avoiding discrepant elements.
The following shows the distribution of all the correlation coefficients in the table.
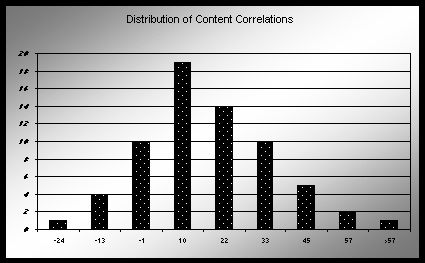
The single outlier on the far right is the Luke-TF pair. The mean of the distribution is 12, and the standard deviation is 18, making the Luke-TF pair at 68 more than 3 standard deviations away, significant at the 99% confidence level.
This leaves no doubt
that this sort of relationship among any two of the texts is indeed extraordinary,
and cannot reasonably be attributed to chance.
Readers who wish
to comment on the methodology of this study are invited to write
to me. I believe that, whether one accepts this particular analysis
or not, the closer one studies the texts the more convinced one will become
that there is something special about the Luke-Testimonium relationship.